Portfolio Performance Dashboard: Traditional vs AI-Powered
5-Year Performance Comparison (2020-2025)
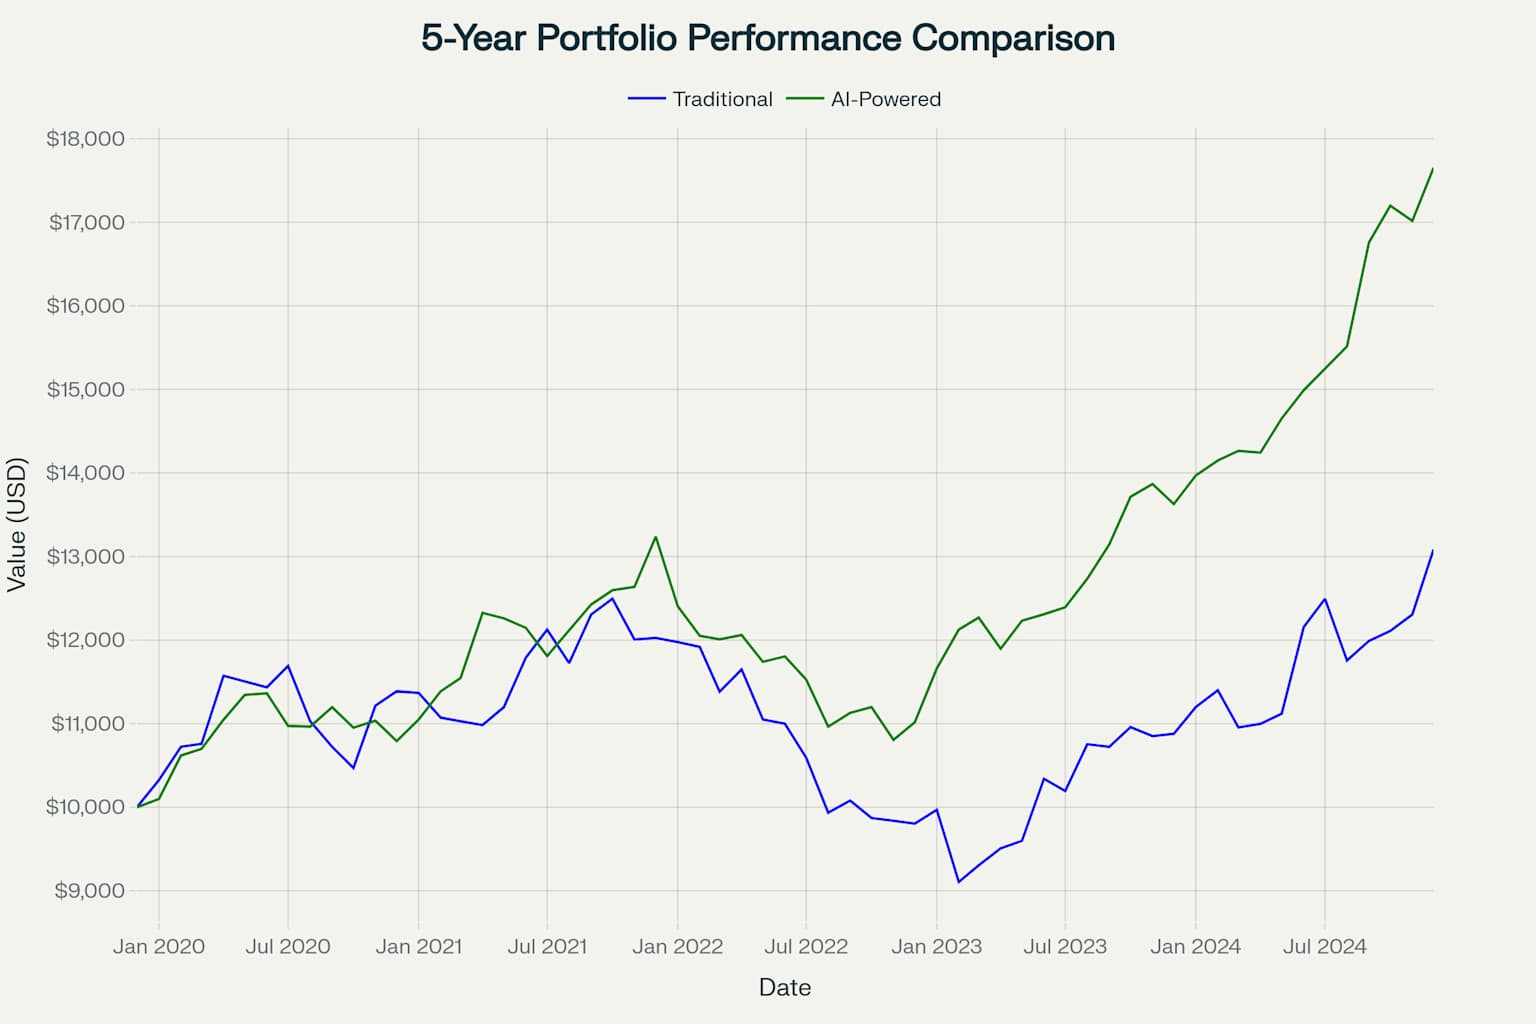
This dashboard compares the performance of a traditional stock portfolio with an AI-powered portfolio that adapts to real-time market sentiment and macroeconomic trends. Explore how intelligent adaptation to market conditions can potentially improve investment outcomes.
Portfolio Performance Over Time
Key Performance Statistics
| Metric | Traditional Portfolio | AI-Powered Portfolio |
|---|
Risk vs. Return Analysis
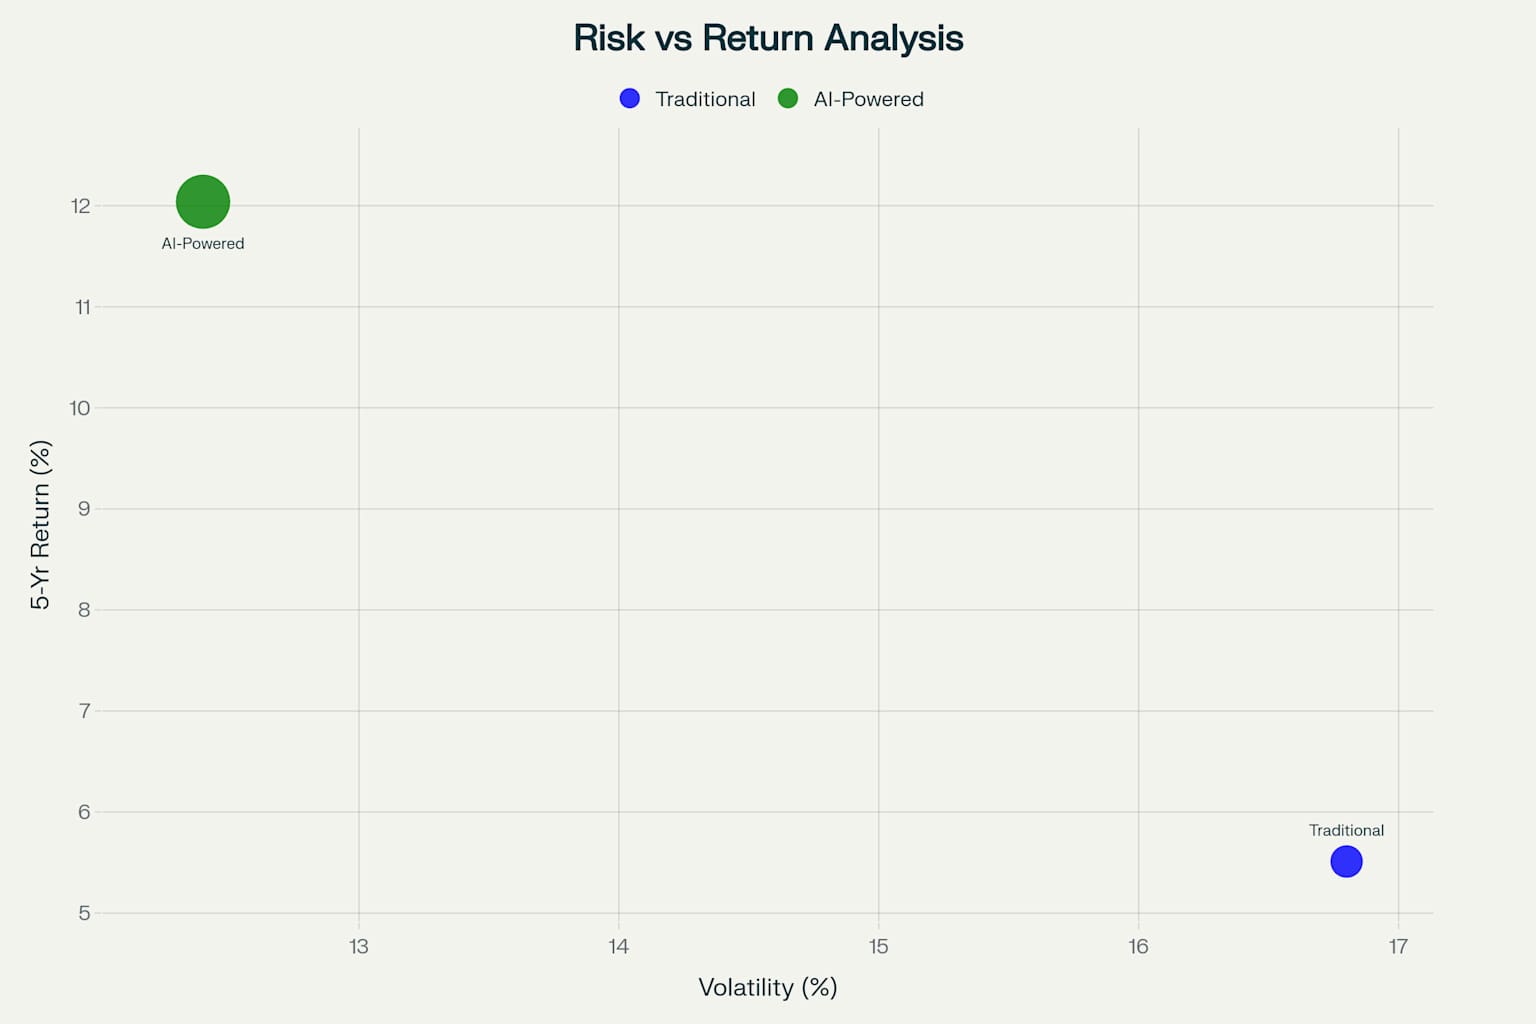
Risk Metrics
| Metric | Traditional Portfolio | AI-Powered Portfolio |
|---|
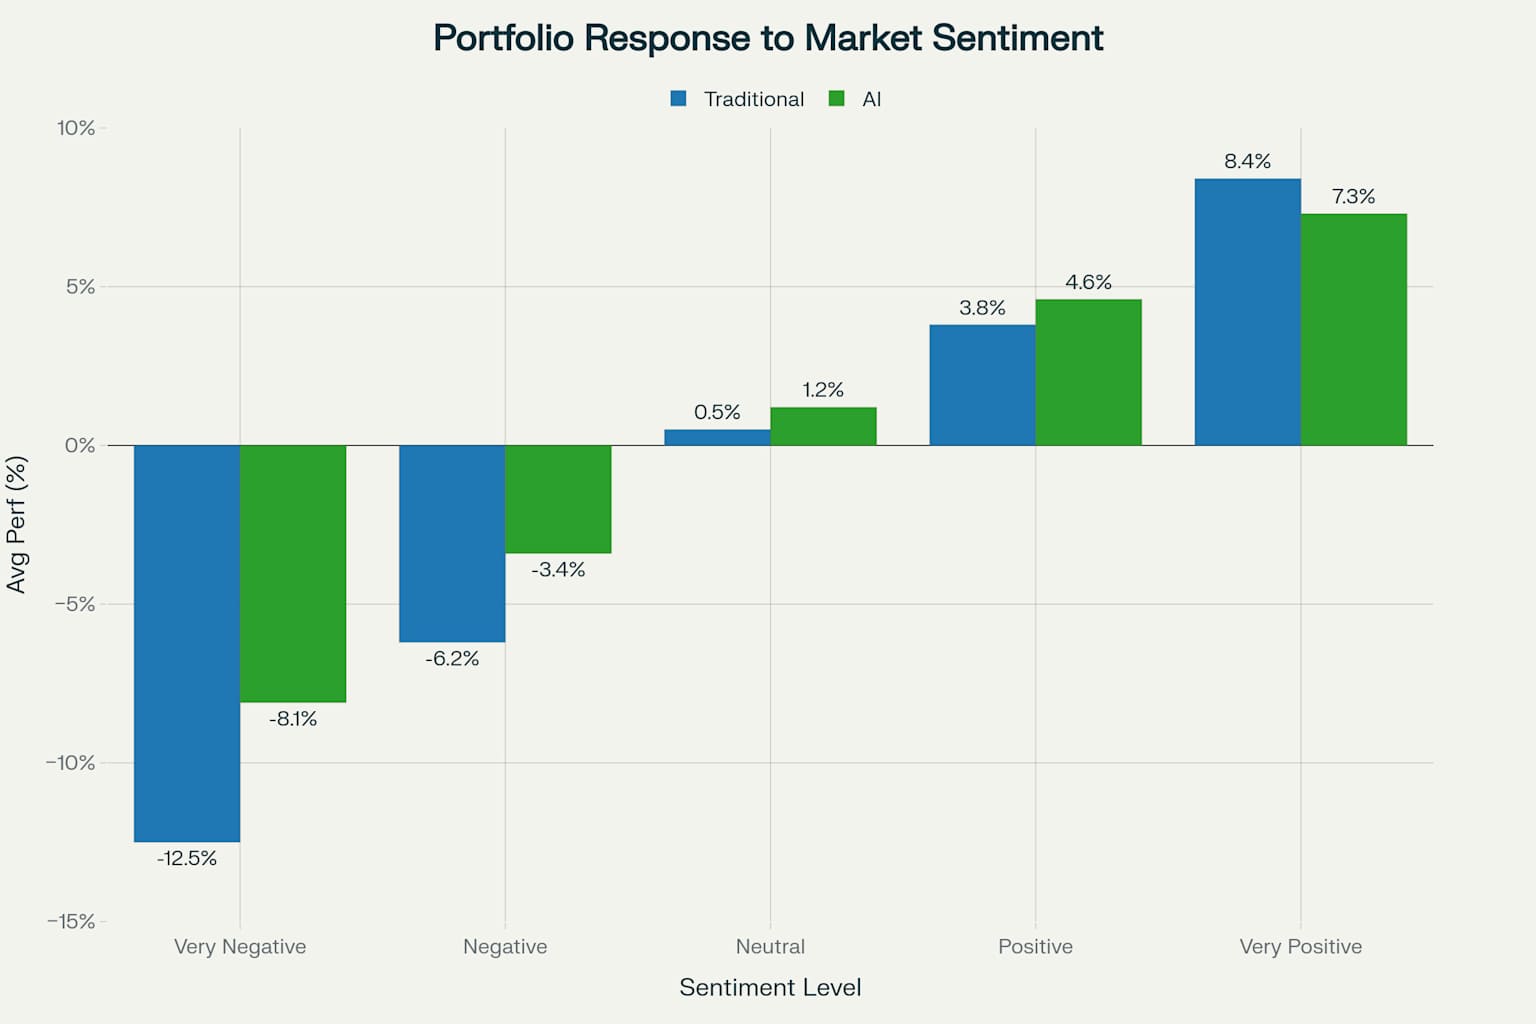
Portfolio Response to Market Sentiment
Current Market Sentiment
Macroeconomic Indicators
AI Portfolio Adaptations
Traditional Portfolio Allocation
AI-Powered Portfolio Allocation
Allocation Strategy Comparison
Traditional Portfolio: Follows a static allocation strategy with a heavy focus on US Large Cap stocks (60%). This approach maintains the same allocations regardless of market conditions, making it predictable but potentially missing opportunities during market shifts.
AI-Powered Portfolio: Employs a dynamic allocation strategy that adjusts based on market sentiment and macroeconomic indicators. With more diversification across asset classes and the ability to adapt to changing conditions, this approach has demonstrated superior risk-adjusted returns. The AI portfolio has a more balanced allocation across international markets and maintains a small position in commodities as a hedge against inflation.